An excerpt of the Professional-tier specimen. The portfolio is hypothetical: 30 large-cap U.S. equities at stepped weights, constructed to exercise the report; it is not a client portfolio and not a model portfolio. The specimen runs 4 pages; the production report is specified at 8–12 pages.
MARNELLO LLC · Portfolio Evidence ReportPortfolio: Sample Balanced Equity (hypothetical) · As of 2026-08-31 · Professional tier
Demo build · Illustrative · See methodology note Excerpt of the Portfolio Evidence Report specimen (PDF, 4 pp). Demo build on free data; see the methodology note in the PDF.
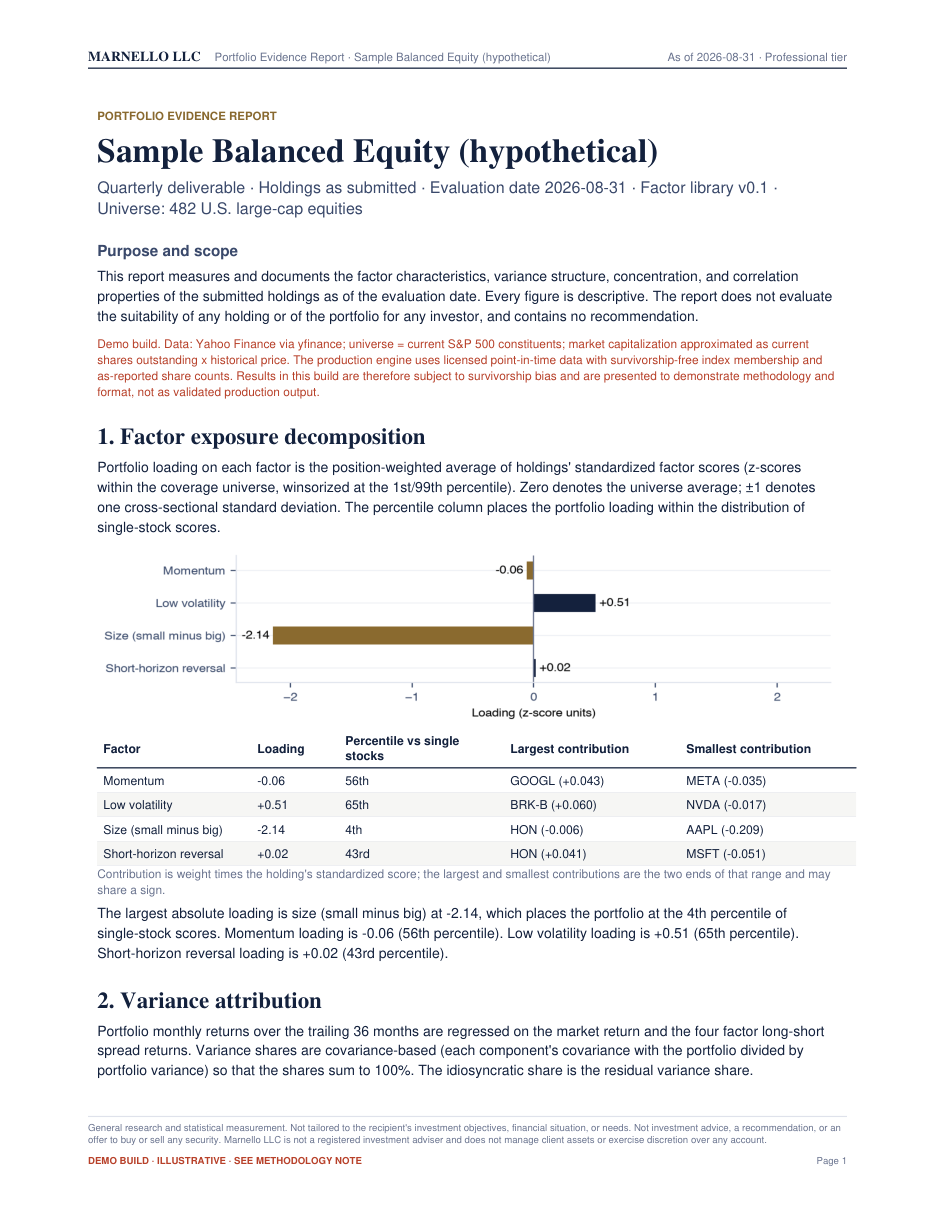
1. Factor exposure decomposition
Portfolio loading on each factor is the position-weighted average of holdings' standardized factor scores (z-scores within the coverage universe, winsorized at the 1st / 99th percentile). Zero denotes the universe average; ±1 denotes one cross-sectional standard deviation. Percentiles place the portfolio loading within the distribution of single-stock scores.
Momentum
-0.06
Low volatility
+0.51
Size (small)
-2.14
Reversal
+0.02
The largest absolute loading is size (small minus big) at -2.14 (4th percentile) of single-stock scores. Momentum loading is -0.06 (56th percentile). Low volatility loading is +0.51 (65th percentile). Short-horizon reversal loading is +0.02 (43rd percentile).
2. Variance attribution
Portfolio monthly returns over the trailing 36 months are regressed on the market return and the four factor long-short spread returns. Variance shares are covariance-based (each component's covariance with the portfolio divided by portfolio variance), so they sum to 100%.
| Component | Share of portfolio variance |
|---|
| Market | 111.8% |
| Style factors (momentum, low volatility, size, reversal) | -19.0% |
| Idiosyncratic | 7.2% |
| Total | 100% |
Systematic sources (market plus style factors) account for 92.8% of variance; the regression R² is 0.93. Market beta is 1.12. Annualized volatility over the window is 11.5% against a tracking error of 6.0% to the S&P 500 ETF. Maximum drawdown over the window is -5.8%.
How to read a negative variance share. A component's share can be negative, and another's can exceed 100%, because each share is the component's covariance with the portfolio return divided by portfolio variance: a negative share means that component moved against the portfolio over the window and reduced total variance. It is not an error. Here the style-factor share of -19.0% offset part of the market contribution, which is why the market share exceeds 100%.
3. Concentration and risk contribution
0.0364
Herfindahl index · effective number of positions 27.4
0.10
average pairwise correlation among holdings, trailing twelve months of daily returns
4. Methodology and limitations (excerpt)
Factor definitions, estimation windows and validation results are documented in Appendix A of the PDF. Estimates on 36 monthly observations carry wide confidence intervals. All figures describe historical characteristics of the submitted holdings over the stated windows and do not forecast future behaviour. The report expresses no suitability opinion on any holding or on the portfolio for any investor and contains no recommendation.
General research and statistical measurement. Not tailored to the recipient's investment objectives, financial situation, or needs. Not investment advice, a recommendation, or an offer to buy or sell any security. Marnello LLC is not a registered investment adviser and does not manage client assets or exercise discretion over any account.